Additional information about interpreting histograms is presented in my Complete Guide books.
Every digital camera user needs to understand the exposure tools their camera provides. One of those is the histogram. Unfortunately, camera manuals don't provide much help in evaluating histograms, and (when this article was originally written in 2002) not a lot has been written about them. Moreover, I haven't been able to find many illustrated examples. The purpose of this page is to help fill in that gap in information.
But first, I need to establish a few "basics." When viewing on the camera, the primary histogram faults to look for, in order of precedence are:
Histogram extends off right edge.
Result: loss of highlight detail.
Worst case: a tall line at the right edge of the histogram. The taller the line, the more highlight information you've lost.
Histogram extends off the left edge.
Result: somewhat unrecoverable shadow detail (exposure changes with NEFs can be pulled back sometimes with raw converters, but in JPEGs shadow detail is not usually recoverable due to the small number of bits the data is in).
Worst case: a heap that peaks at the left edge and has NO exposure to the right of center.
Histogram extends from side to side, but there are almost no values towards the extremes (e.g., the entire right or left portion of the histogram is nothing more than a flat line).
Result: most of the image is low contrast and that is somewhat problematic to print without Photoshop manipulation (shadow and highlight detail may be tough to hold together—you may have to pick one or the other to avoid tonal posterization in some cases). Worst case: small lines at either or both edges indicate a scene whose exposure is outside your camera's ability to record, but most of what was recorded was low in contrast!
Histogram is peaked in one narrow area, and doesn't extend towards edges.
Result: you'll be using Curves to pull out the detail in Photoshop, and the more narrow the peak is, the tougher that task will be. Again, same as above: the image is low in contrast.
Worst case: the peak is in the lower 1/4 of the scale, which would indicate underexposure, and would produce more noise when you correct the exposure later.
Okay, we're ready to look at some real histograms:
So let's start with a simple histogram. Look at that histogram on the right. If you've ever taken a well-exposed picture of a gray card, you should recognize this histogram. There's one well defined peak because virtually all the values on the card are the same. The peak is just left of center because a gray card is 18% gray, not 12% (see my discourse on that subject for more). I've got a few straggler areas to the left of the main peak because I wasn't particularly careful about keeping a bit of shadow off the card.
Here's a slightly more difficult histogram to recognize, but one that many of you should have seen before. The giveaway is that there are a number of distinct peaks. Peaks always indicate the presence of a large number of pixels that are all the same value. Again, I've got a bit of shadow on my subject, so the peaks aren't as distinct as they sometimes are, but this is a histogram of a correctly exposed Macbeth ColorChecker card.
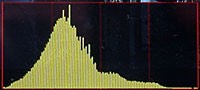
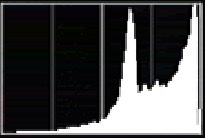
So here's our first puzzler. What's this a histogram of? It's darn near perfectly exposed (the Highlights setting on my D1x showed no flashing pixels indicating no loss of highlight detail). The bulk of the pixels are just to left of center, which I consider the D1x's "sweet spot" for exposure, as it gives me the most flexibility for post-exposure adjustment. While there are pixels to the right of center, they're spread out across a wide range and there are more of them the further you get from white (right edge). This means I should be able to easily control and manipulate highlight detail. Likewise, I don't have any pixels that fell off into black at the left. In other words, I've managed to keep every pixel of the image in the dynamic range of the camera. (Hint: I was using both a polarizer and a 2-stop graduated neutral density filter to pull the bright areas down.)
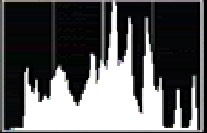
This is a reasonably well-controlled landscape shot (in this case, taken from the viewing area above the Kennedy memorial at the Arlington National Cemetery. Generally, I try to keep a histogram from falling off either edge, and in this case, I was successful. (Note that the Unsharp Mask and JPEG compression has taken some of the brighter areas to absolute white in the example you see at left.)
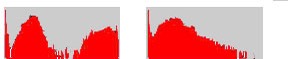
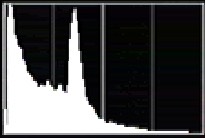
Here are a pair of histograms (pulled from Digital Pro) taken within moments of one another. I changed only one thing between shots (hint: I added something). Can you guess what it was and why I added it?
I added a graduated neutral density filter. (The picture was of Bryce Canyon near sunset, but unfortunately, I've seen to have lost the example photo in many gigabytes of images on my network at the moment.) The hump at the far right was basically the sunset sky (the unlit hoodoos below the ridge were the left hump). The ND filter brought all the sky values down into the same general exposure as the landscape, which allowed me to use contrast control to spread the histogram.
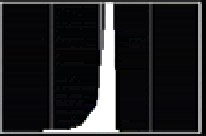
Okay, that's the basic histogram. Now consider this: on the higher end Nikon bodies you can view histograms for each channel (red, green, blue, and luminosity). I go into why that's important in my Complete Guide books, if you're interested.
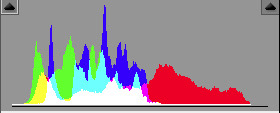
Notice anything unusual about this color histogram? It's Patagonia red rock at sunrise, which is why the red channel is so far about the luminance channel.