Every new camera introduction causes one portion of the buying population to wait…for the DxOMark results. I’ll be right up front with you about my opinion: if a magic number is what causes you to buy or not to buy a camera, you probably shouldn’t be reading this site.
The latest round of DxO fretting comes with the release of their Canon 7DII numbers. One headline on another site put it this way: “Canon EOS 7D Mark II DxOMark test score: identical to the 5 years old Nikon D300s camera.” Uh, okay. That’s referring to DxOMark’s “overall score” value, which if anyone can clearly explain how they come up with that single number, let alone what it actually means in a pragmatic sense, I’d be appreciative. The DxOMark Overall Score is one of those faux statistics that attempt to put a lot of test data together with a lot of assumptions and come up with a single representative numeric value. Quick way to know that it’s faux: what’s the difference you’d see in a camera labeled “70” versus “72”? Right, thought so.
I’ve written before how the digital camera world has basically followed the old high fidelity world in terms of numbers-oriented marketing and testing. Back in the 70’s and 80’s people got crazy about frequency or power ratings for high fi gear. Yet in the long run, people who listened to the products found that slavish devotion to buying better numbers didn’t actually get them “better sound.”
One thing a lot of folk don’t get is that raw tests tend to be demosaic dependent. As I’ve pointed out before, Adobe converters do a better job with little override on Canon raw files than they do on Nikon raw files. Okay, so how does that play into DxO results? Are you the type that tends to allow the converter to do its thing with minimal extra adjustments, or are you the perfectionist looking for every degree of image quality you can extract, regardless of what converter you have to end up using and how much you have to tweak?
Not that I’m defending the 7DII here. Still, let’s take just one look at the DxOMark measurements to see if that 7DII = D300s statement made in that headline stands up:

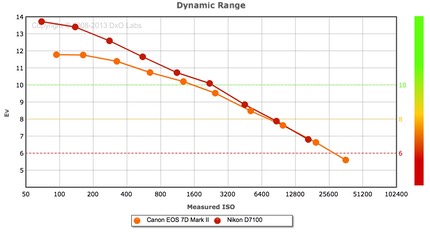
Not really. At base ISO, the two are close, sure, but look at what happens as you boost ISO. Indeed, if you’re going to look at DxOMark tests, I suggest that you always pull up the “Measurements” tab and look closely at what’s going on there. You’ll find instructive information, including the measured ISO as opposed to the marked ISO, which sometimes distorts the results a bit. Just from the above chart, for instance, I can quickly tell that I probably have no real preference of 7DII or D300s at base ISO, but as I push ISO values up, I clearly would have a preference of the 7DII. To be fair, here’s the same comparison between 7DII and D7100:

Interestingly, an opposite reaction: I’d prefer the D7100 at low ISO values, but as I bump upwards, my preference disappears.
It’s interesting to note that DxO seems to be playing a lot of angles. First, they are presenting themselves as impartial, numeric oriented testers (e.g. the scores). Second, they are presenting themselves as reviewers (e.g. "If Canon could only address performance at base and low ISO, the EOS 7D Mk II would make a thoroughly convincing all-round choice, but in this category the Sony A77 II looks to be the more compelling option."). Third, they sell their test equipment and software test suites to camera companies (Nikon, for instance, but I don’t believe Canon is one of their clients). Fourth, they present themselves as the best demosaic option, better than the camera makers’ options (e.g., DxO Optics Pro). They have some clear conflicts of interests that are not easily resolved. So be careful of just gobbling up their “results” as absolutes.
Personally, I love numbers generated by known test methodologies (not faux numbers with unstated assumptions). They give me places to look for things that are impacting performance, and ideas of how I might optimize my eventual results from a product. As many of you know, I’m a tester at heart. I no longer run quite as many tests as I used to on new gear, but I’ve got a full suite of tools available to me, and I tend to immediately start running tests on any new gear that gets unboxed at the office. Initially, I’m looking to see if a number or test shows something very different than previous gear I’ve used. That gives me clues on what to do next. DxOMark’s tests do give us some things we can study (again, drop down into the Measurements tab).
So, for example, the 7DII has a landscape dynamic range of 11.8EV, the D7100 a range of 13.7EV. Before moving on, I should note that these aren’t exactly what you’d get out of the camera in images (e.g. 12 stops of data on the 7DII, 14 on the D7100). DxOMark’s numbers are closer to engineering DR than usable dynamic range, even with their adjustments for “print” and “screen." Engineering DR is measured between the lowest value that hits a signal-to-noise ratio of 1:1 (which we’d never use) and the highest saturation value of the sensor. Pragmatic DR has no agreed upon definition. When I report dynamic range numbers, as I do in my books, these are based upon my own personal standards, which have some fairly strict observed guidelines towards visibility of noise of any kind.
Even though those DxO-reported numbers aren’t what I’d expect in my images, they do tell me something: I might be able to dig more shadow detail out of the D7100 image than the 7DII image at base ISO, all else equal. That’s actually no surprise. This has been true of the Sony versus Canon sensor difference for quite some time now. If you’re a big fan of cranking the Lightroom Shadow slider to max, you’re going to be doing more noise correction on a Canon than a Nikon. Nothing’s changed here. However I’d point out that neither camera is likely to be able to hold extreme landscape situations in a single exposure: I’d still be bracketing and applying HDR type techniques to construct images in such cases. Thus, whatever the actual numeric difference in dynamic range between the 7DII and D7100 is at base ISO, it really wouldn’t make much of a difference to my workflow. I might adjust my bracket sets on the Canon to be a bit different than the Nikon to account for the difference in how they handle shadows, but that’s it. Bottom line, I’d get the same image.
At the opposite extreme we have the “anecdotal” testers (in which I’d include my own reviews, as I no longer publish numerical results). They’ll often write things like “no visible noise at ISO 3200” or “easily handled noise at ISO 6400” or “the X camera looks better to me than the Y camera."
Do you trust their eyes, and do you trust their use of language? (In my own defense I’ll point out that I was trained in low level pixel awareness and manipulation by some of the best in the business, and for 35 years I’ve been writing reviews of products in national publications that needed careful word use and discrimination. If I were bad at that, I wouldn’t be still doing it and no one would be reading what I wrote.)
Which brings us full circle to the DxOMark numbers: do you trust their measurements, and do you trust that they are telling you something photographically useful?
I’m pretty sure DxO is rigorous in its testing methodology. Whether the things they’re testing are completely useful in describing image quality is another story. For example, dynamic range stated with a degree of precision one decimal point to the right. While photographers are always asking for more, I’d point out that dynamic range is one of the most manipulated things in the final images we see. The printed page, for example, can’t directly reproduce the huge range I see at the moment looking out the window at Utah red rock, some in bright light, some in deep shadow. What we do is squeeze and manipulate the captured dynamic range into the printable range, and in doing so, we move values all over the place.
Remember Velvia? Every photographer that shot slide film loved Velvia, right? Okay, maybe not every one, but in the late 90’s it was clearly the number one emulsion we were seeing on image submissions at Rodale (Rodale recommended Provia, by the way; you'll find out why in the next paragraph).
Velvia was characterized by…wait for it…a quick and sharp drop to black in the shadows. It sacrificed shadow detail for shadow contrast. If DxOMark were to measure them the way they do sensors, Velvia would have a smaller dynamic range than Provia. So that makes Provia better, right?
It was for Rodale for a reason: the extra shadow detail capture meant that we could move the dynamic range around a bit for the special inks and papers that we used (soy based inks, highly recycled paper content with low brightness).
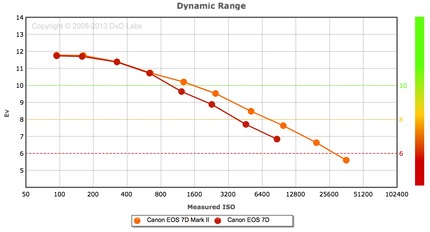
Which brings me to a final point about the 7DII folk: they want the 7DII for what it does for them at higher ISO values versus their previous camera:

So I guess the point I’m trying to make here is to understand why it is that you’re even looking at test results such as DxOMark. You can certainly draw some conclusions from their results. But not “92 is better than 76” or any other Overall Score mark. You have to look at something specific, e.g. dynamic range, and understand why that might be important to you.
If I were a 7D user, I would have loved to have seen the entire dynamic range graph for the 7DII move upward. Canon users still have base ISO dynamic range envy with the Sony/Nikon shooters. But look again at that last chart: above ISO 800, the new camera is making a strong gain of about a stop over the older one. Given how I’d expect to use such a camera (sports, wildlife, etc.), that’s the kind of gain I’d want to see most.
I guess to end this discussion, I should probably suggest what we Nikon users want to see on the DxOMark tests for the next Nikon. We’ve got it pretty good at the moment, after all. Incremental movement of the dynamic range chart upward would always be welcome, but I think we’re now very close to the point where we want to see something entirely different. We really want to see base dynamic range unbound (e.g. the two-shot type DR that the Apple iPhone 6 is doing, and which Sony’s latest patents all hint at). Beyond that, we want to see flattening of the dynamic range slope as ISO is boosted (less of a hit per doubling of ISO).
Simply put, we’re deep ending into small, incremental gains that aren’t pushing us very much further above the “good enough” bar. What we need is to push that bar far forward again, and that’s going to take another sensor generation/design, I think. Until then, you can all anguish over small differences in DxOMark measurements, but I’d be surprised that those show up anywhere near as clearly in your images.